Drawing Charts in SwiftUI
Every now and then I need to visualise data in some nice looking charts. This post will show how to draw charts in a SwiftUI-application.
Starting a charting-package from scratch was not an option due to time- and budget-constraints, so I had to look for existing solutions.
My vote fell for SwifUI-Charts which offers really nice looking graphs and an easy integration.
Setup and Project Configuration #
We start by creating a project in XCode first.
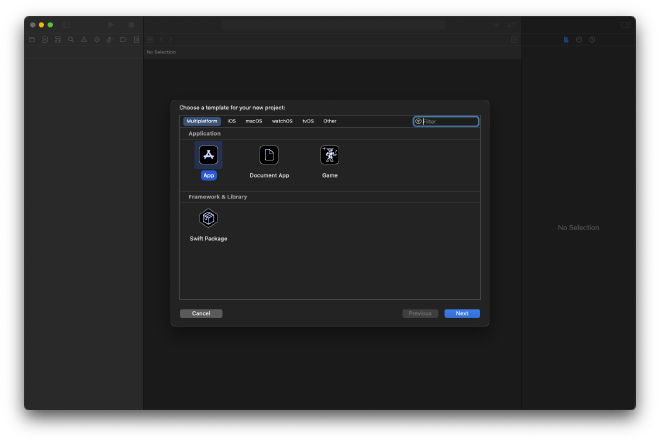
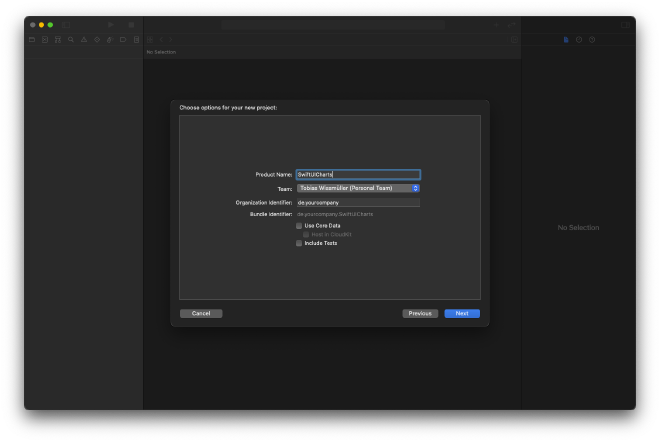
The starting point is the standard SwiftUI-application that is going to be modified.
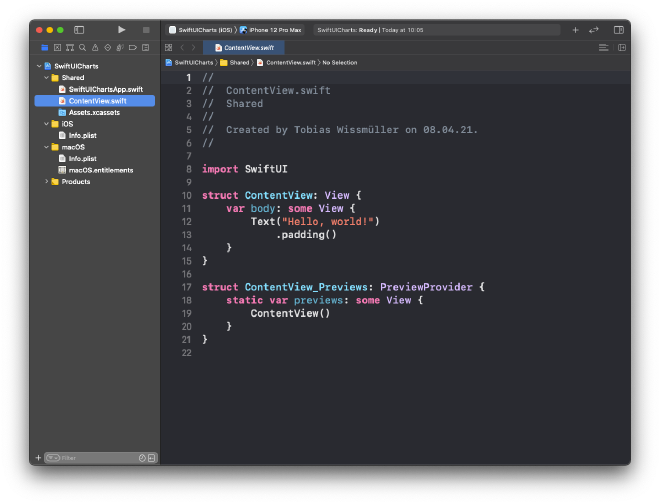
In the next step, the package will be added by opening the project settings first.
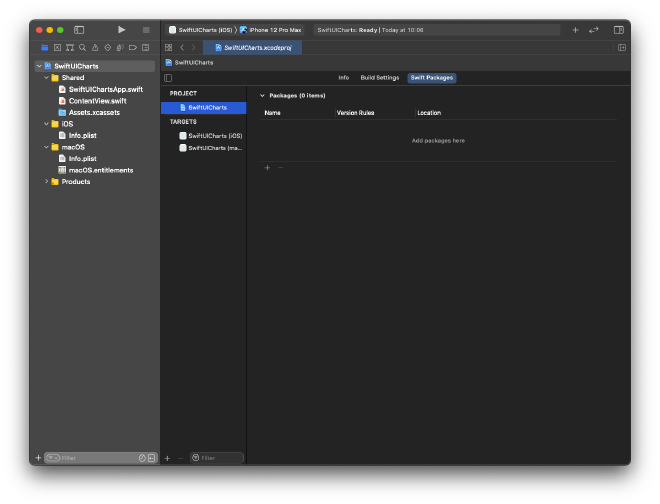
By pressing on the “plus”-button a new package can be added. Here, the full path to the repository needs to be added: https://github.com/spacenation/swiftui-charts.git.
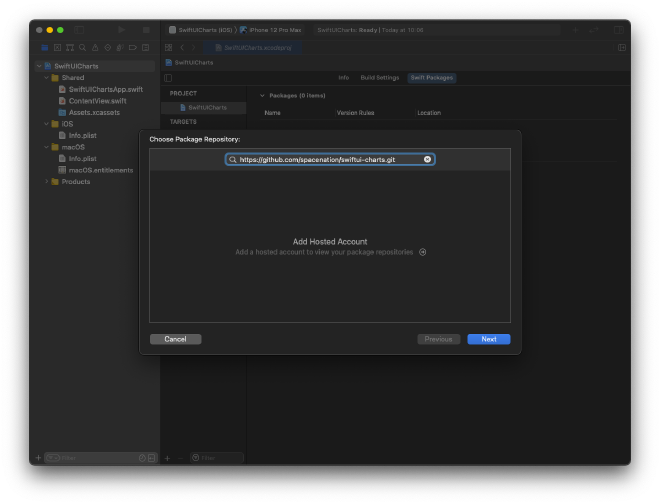
In the next screen left everything at its default values.
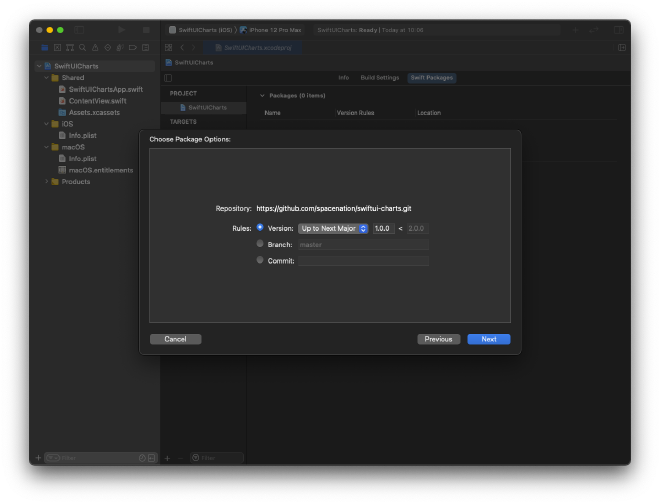
In the last screen I have also left the default values as they were.
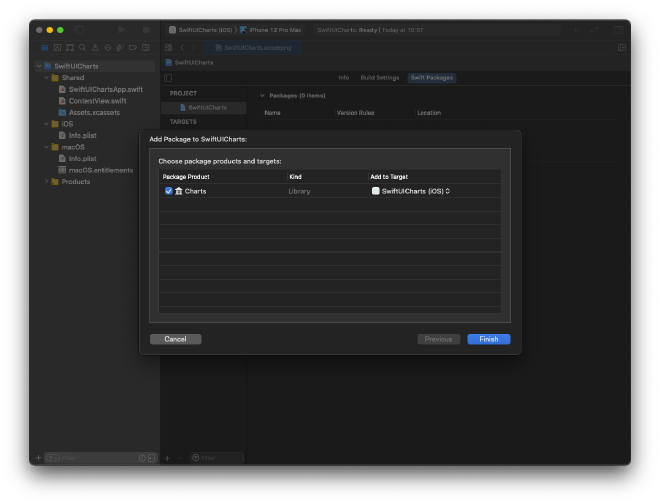
Displaying Constant Data #
It is time to add the code. For a first test I just took some code snippets from the Github-Readme and added it to my ContentView:
import Charts
import SwiftUI

struct ContentView: View {
    var body: some View {
        Chart(data: [0.1, 0.3, 0.2, 0.5, 0.4, 0.9, 0.1])
            .chartStyle(
                LineChartStyle(.quadCurve, lineColor: .blue, lineWidth: 5)
            )
    }
}
When running this in the simulator, a nice graph will be drawn showing the constant values.
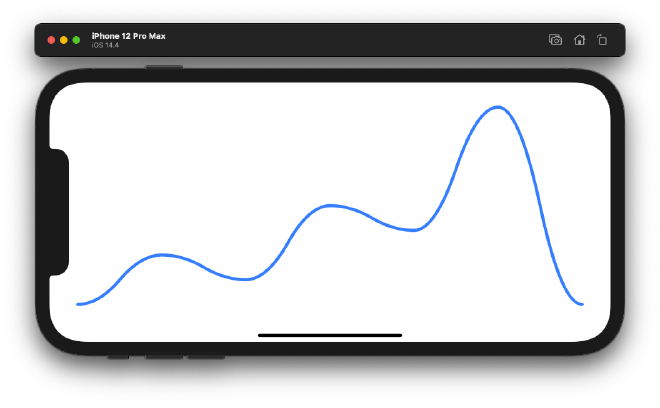
This qualifies as a first successful test.
Displaying Dynamic Data #
In the field I work in, the data I have to visualise changes over time, for example from sensory input. Let’s extend the example to dynamically update the graphs according to the change of the data.
The “sensor” shall be a class of ObservableObject that just publishes a random Double-value every 500 milliseconds.
import Foundation

class ValuePublisher: ObservableObject {
    @Published var value: Double = 0.0

    init() {
        Timer.scheduledTimer(withTimeInterval: 0.5, repeats: true) { timer in
            self.value = Double.random(in: 0...1.0)
        }
    }
}
This needs to be instantiated in the ContentView as a @State variable.
@StateObject var valuePublisher = ValuePublisher()
The ValuePublisher only emits single values, but we need to have those values available in a list. A simple queue-structure does the trick.
struct Queue<T> {
    var list = [T]()

    mutating func enqueue(_ element: T) {
        list.append(element)
    }

    mutating func dequeue() -> T? {
        if !list.isEmpty {
            return list.removeFirst()
        } else {
            return nil
        }
    }

    func peek() -> T? {
        if !list.isEmpty {
            return list[0]
        } else {
            return nil
        }
    }
}
This queue will be instantiated as a @State variable in the ContentView
@State var doubleQueue = Queue<Double>()
The underlying list needs to be initialised when the view appears.
.onAppear {
    doubleQueue.list = [Double](repeating: 0.0, count: 50)
}
The chart also needs to know about the list that holds the values.
Chart(data: doubleQueue.list)
In a last step, the published values of the ValuePublisher have to be added to the queue and the oldest value of the queue has to be removed.
.onChange(of: valuePublisher.value) { value in
    self.doubleQueue.enqueue(value)
    _ = self.doubleQueue.dequeue()
}
That’s about it, here is the full ContentView where I have also changed the appearance of the graph a little bit.
import Charts
import SwiftUI

struct ContentView: View {

    @State var doubleQueue = Queue<Double>()

    @StateObject var valuePublisher = ValuePublisher()

    var body: some View {
        Chart(data: doubleQueue.list)
            .chartStyle(
                AreaChartStyle(.quadCurve, fill:
                    LinearGradient(gradient: .init(colors: [Color.blue.opacity(1.0), Color.blue.opacity(0.5)]), startPoint: .top, endPoint: .bottom)
                )
            )
            .onAppear {
                doubleQueue.list = [Double](repeating: 0.0, count: 50)
            }
            .onChange(of: valuePublisher.value) { value in
                self.doubleQueue.enqueue(value)
                _ = self.doubleQueue.dequeue()
            }
            .padding()
    }
}
Here is a screenshot of the final application
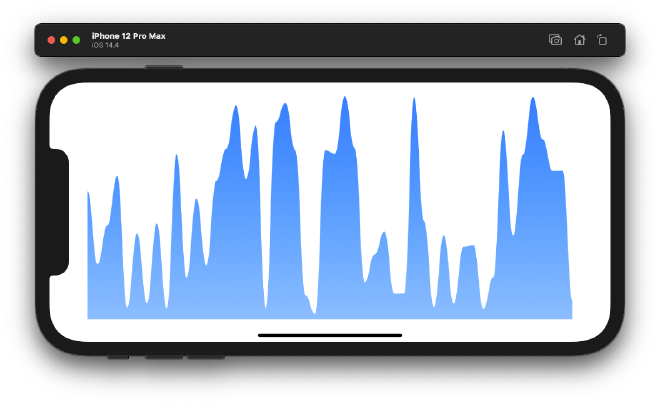
I have also uploaded a video for you to see how it looks when the values get updated dynamically.
Feel free to buy me a coffee if you liked this post.